
Super Fund Returns Australia: What They Mean & How to Use Them

Super Fund Returns Explained
A super calculator can tell you a lot about where your retirement is heading, but only if you understand what the returns going into it actually mean. And for most Australians, super fund returns are either ignored entirely or misread in ways that lead to poor decisions.
The headlines say "super funds returned 9.3% in 2025." Your statement shows your balance grew. Everything feels fine. But what does that number actually mean? Is it good? Is it typical? And more importantly, what does it mean for your retirement in 20 or 30 years?
This article explains super fund returns from the ground up: what drives them, what the long-term numbers actually look like, and how to use a super calculator Australia-wide like Delphi IQ to turn those returns into a real retirement picture.
Disclaimer: The information in this article is general in nature and does not constitute financial advice. Past performance is not a reliable indicator of future returns. Investment returns are not guaranteed. Before making any decisions about your super, consider seeking advice from a licensed financial adviser. Verify current fund performance at Chant West or your super fund's website.
TL;DR
- The median Growth super fund returned 9.9% in 2025, following 11.4% in 2024 and 9.9% in 2023. These figures are reported before administration fees and represent more than 30% cumulative growth over three years. Source: Chant West.
- Over 33 years since compulsory super began, the median Growth fund has returned 7.9% per year on average.
- Short-term returns are driven primarily by share markets. Long-term returns reflect the power of compound growth over decades.
- The gap between the best and worst super funds over 10 years is significant, which fund you're in matters as much as what the market does.
- A superannuation calculator Australia-wide like Delphi IQ turns these return figures into a projected retirement income based on your actual situation.
What "Super Fund Returns" Actually Means?
When a super fund reports its return for the year, it is telling you how much the investments inside the fund grew, net of investment fees and tax, before administration fees and adviser commissions.
For most Australians, the relevant benchmark is the Growth fund option, defined as funds with 61 to 80 per cent of assets in growth investments like shares and property. This is the default investment option for most Australian super funds and where the majority of members are invested.
The return figure you see reported in the media, "super funds returned X per cent", is typically the median Growth fund return, meaning half of all Growth funds performed above that figure and half below it.
It is important to understand what this number does not include. It does not factor in your fund's administration fees, insurance premiums deducted from your account, or the specific asset allocation of your particular fund or investment option. Your actual return may be higher or lower than the median.
The Recent Numbers: Three Strong Years in a Row
Australian super funds have delivered three consecutive years of strong returns, driven primarily by share market performance.
According to Chant West:
- 2023: Median Growth fund returned 9.9%
- 2024: Median Growth fund returned 11.4%
- 2025: Median Growth fund returned 9.3%
Combined, this represents growth of more than 35% over three years, a significant outcome for members invested in growth options.
The primary driver in 2025 was international share markets, which delivered 18.6% on a currency-hedged basis. Australian shares also contributed, returning 10.7% for the year. Growth funds have on average 31% of their total investments in international shares and 25% in Australian shares, meaning share market performance is the single biggest determinant of annual returns for most members.
For the financial year to June 2025, the median Growth fund returned 10.5%, the 14th positive return in 15 years and well ahead of the typical long-term objective of around 6% per year.
What These Returns Look Like Across Risk Categories?
Not everyone is invested in a Growth fund. Returns vary significantly depending on the risk level of your investment option.
For the 2025 calendar year, Chant West reported the following across risk categories:
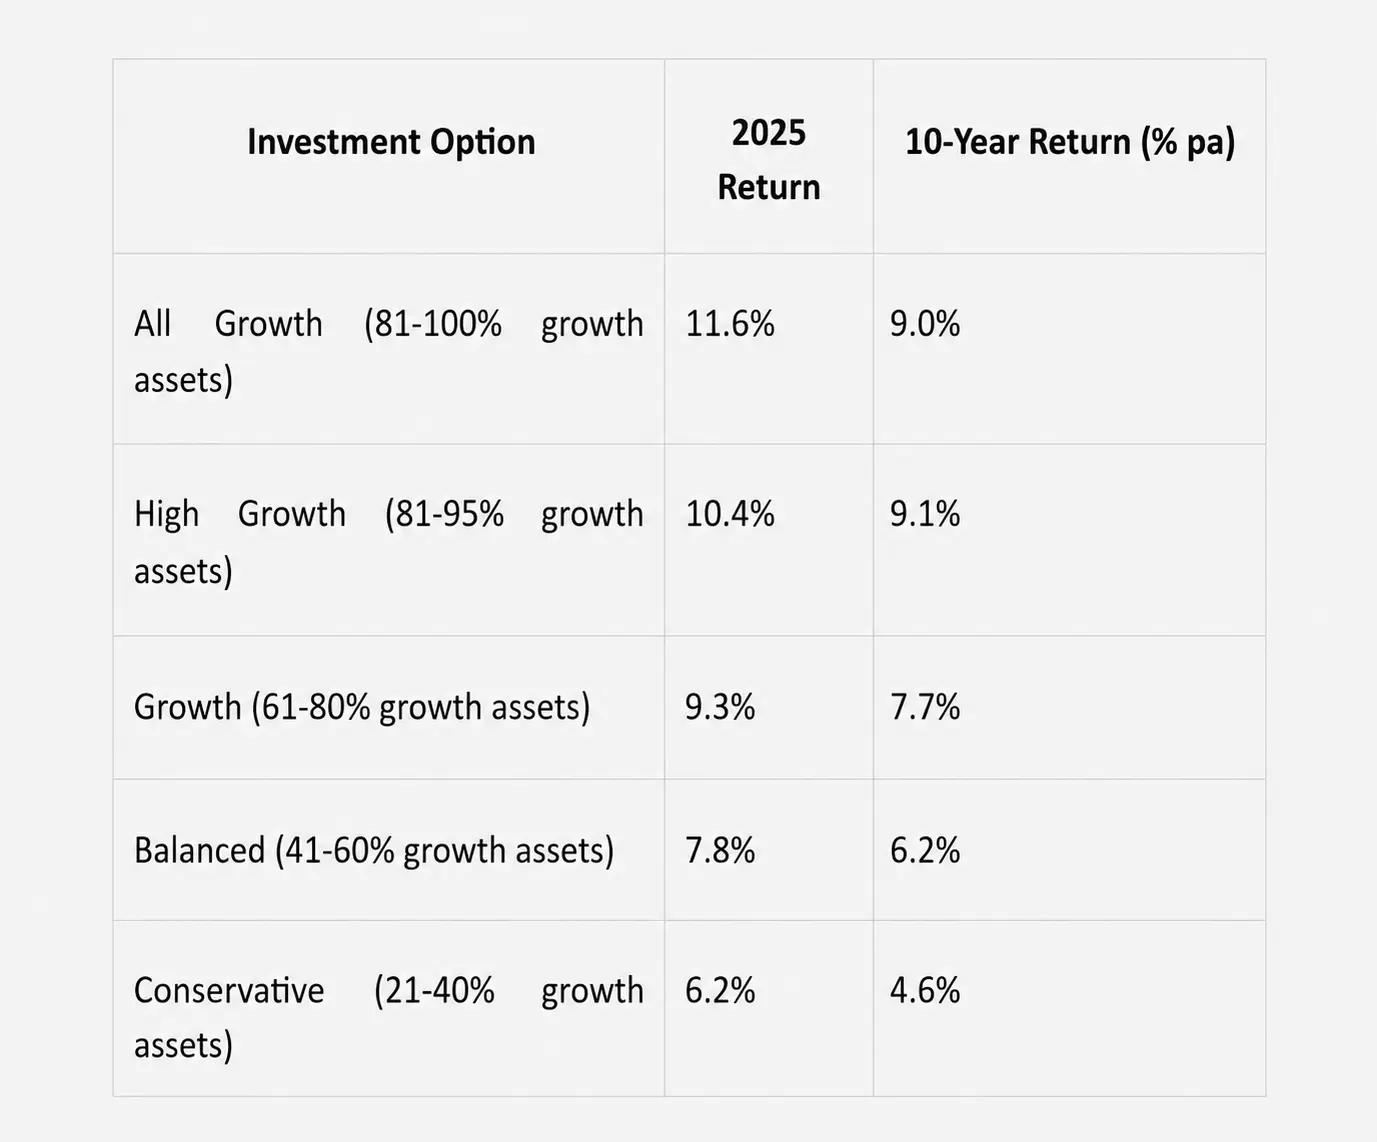
Source: Chant West — Another strong calendar year result for super fund members
Performance is shown net of investment fees and tax, and before administration fees.
The Long-Term Picture: What Really Matters for Retirement
The annual headline return is not what determines your retirement outcome. What matters is the compounding effect of returns over decades.
Since the introduction of compulsory superannuation in July 1992, the median Growth fund has returned 7.9% per year on average. The average annual CPI increase over that same period is 2.7%, giving a real return, after inflation, of 5.2% per year. This is well above the typical long-term target of CPI plus 3.5% per year.
To put that in perspective: $100,000 invested at 7.9% per year for 33 years becomes approximately $1.14 million. That is the power of compound growth across a working lifetime, and it is why the super calculator result for someone starting contributions in their 20s looks so different from someone starting in their 40s.
Growth funds have produced positive returns in 28 of the past 33 financial years. Their typical risk objective is no more than six negative return years in that period. There have been just five, meaning the risk objective has been met as well as the return objective.
The three major downturns in the past 25 years, the Global Financial Crisis in 2007-09, the COVID sell-off in 2020, and the inflation-driven falls in 2022, have all been followed by recovery. Even looking at the past 20 years, which includes all three of those downturns, the median Growth fund has returned 6.5% per year.
Why Your Choice of Fund Matters More Than Most People Realise?
The median return is useful as a benchmark, but it conceals significant variation between funds.
In the 2024-25 financial year, the average MySuper product returned 10.6%. The best returned 13.5%. The worst returned 7.6%. That is a gap of 5.9 percentage points in a single year. Source: Money Magazine.
Over 10 years, the difference compounds dramatically. The average annual performance gap between the best and worst MySuper products over the past decade has been approximately 8.7% per year. That translates to a dramatic difference in retirement balances for members who were in the top-performing fund versus the lowest-performing fund over the same period.
This is why checking your fund's performance, using the government's ATO YourSuper comparison tool, is one of the most practical things you can do for your retirement outcome. It takes minutes and it puts your fund's performance in direct context.
The Lesson From Market Downturns: Stay the Course
The pandemic crash of 2020 was one of the sharpest market falls in history. The ASX fell around 37% in a matter of weeks. Many superannuation fund members panicked, switched to cash, and locked in their losses.
Those who stayed in growth options saw their funds recover within months. The median Growth fund went from deeply negative to recording one of its strongest annual returns in the following year.
The lesson from every major market downturn is the same: members who react to short-term volatility by switching to lower-risk options tend to crystallise losses and miss the recovery. Members who stay the course recover, and often end up ahead of where they started.
As Chant West head of superannuation investment research Mano Mohankumar noted following the market volatility of early 2025: "Members who panicked after seeing their balances fall and switched to lower risk options not only crystallised paper losses, but also missed out on the subsequent rebound."
Source: SuperGuide.
This does not mean never changing your investment option. It means changes should be based on your stage of life and financial goals, not on short-term market movements.
How to Use a Super Calculator to Understand What Returns Mean for You?
Knowing that the median Growth fund returned 7.9% per year over 33 years is useful context. But it does not tell you what your super balance will be at retirement, what income that balance will generate, or whether you are on track.
That is what a superannuation calculator Australia-wide is designed to do.
Delphi IQ is a free super calculator built specifically around Australia's superannuation system. Rather than applying a single assumed return rate and producing one projected outcome, it uses actuarial cashflow modelling to account for real-world retirement risks together, sequencing risk, longevity, inflation, and investment volatility.
Using Delphi IQ, you can:
- Enter your current super balance and contribution rate and see your projected retirement balance
- Model how different investment option return rates affect your long-term outcome
- Factor in the Age Pension to get a realistic total retirement income picture
- Compare retiring at different ages and see the impact on your projected balance
- Test what happens to your retirement income if returns are lower than the long-term average for a sustained period
The goal is not to predict exactly what markets will do, no tool can do that. The goal is to understand the range of realistic outcomes for your situation, so that the financial decisions you make today are based on something more reliable than hope.
Model Your Retirement with Delphi IQ → Try It Free
FAQs
What is the average super fund return in Australia?
Over 33 years since the introduction of compulsory super, the median Growth fund has returned 7.9% per year on average, giving a real return after inflation of approximately 5.2% per year. In recent years returns have been higher, 9.9% in 2023, 11.4% in 2024, and 9.3% in 2025.
What is a Growth super fund?
A Growth fund is a super investment option with 61 to 80 per cent of assets allocated to growth investments, primarily shares and property. It is the most common default investment option for Australian super funds and the benchmark used by research houses like Chant West when reporting median industry returns.
Should I switch to a higher-risk super fund when markets are doing well?
Not necessarily, and not based on short-term returns. Investment option decisions should be based on your age, your time until retirement, and your risk tolerance, not on recent market performance. Switching to a higher-risk option after a strong run often means buying in at elevated prices, while switching to cash during a downturn locks in losses. Use a superannuation calculator Australia to model the long-term impact of different options for your specific situation.
How do I know if my super fund is performing well?
Compare your fund's return against the median for its investment category using the ATO YourSuper comparison tool. Look at 5 and 10-year returns, not just the most recent year, consistency over time matters more than a single strong year.
What is the difference between a super fund return and my actual account growth?
The headline return figure is the investment return net of investment fees and tax, before administration fees, insurance premiums, and adviser commissions. Your actual account balance may grow by less than the reported return after these additional costs are deducted. Always check your annual statement for the net return credited to your specific account.
How can a super calculator help me understand returns?
A super calculator converts return assumptions into projected retirement outcomes, showing you not just your balance at retirement but the income that balance can sustain, how long it might last, and how sensitive your outcome is to different return scenarios. Delphi IQ goes further than basic calculators by modelling sequencing risk and other real-world factors, giving you a more realistic range of projected outcomes rather than a single optimistic number.
What happened to super funds during the COVID crash?
The median Growth fund fell sharply in the March quarter of 2020, one of the fastest market declines on record. Members who switched to cash locked in those losses. Members who stayed in their growth options saw a full recovery within months, with the subsequent 12 months delivering some of the strongest returns in the industry's history. The same pattern has repeated after every major market downturn since compulsory super began.